

Description
The website offers an image database of Indirect ImmunoFluorescence (IIF) images. It is the outcome of a research project jointly conducted by the Mivia Lab of the University of Salerno and the University Campus Biomedico of Rome, with the financial support of “Regione Campania” within the project “Classification of Immunofluorescence Images for the Diagnosis of Autoimmune Diseases”. In this website you can download an annotated database of IIF images, acquired using slides of HEp-2 substrate at the fixed dilution of 1:80, as recommended by the guidelines.

Background
IIF is considered a powerful, sensitive, and comprehensive test for antinuclear autoantibodies (ANA) analysis. Furthermore, it is one of the most effective and widely-used diagnostic screening assay able to detect in a timely manner some pathologies whose incidence has been constantly growing in the last few years.
IIF slides are examined at the fluorescence microscope, and their diagnosis requires both the estimation of fluorescence intensity and the description of staining pattern. The former is scored semi-quantitatively with respect to both positive and negative controls contained in each slide. The latter suggests the localization of reactive nuclear antigens and may help clinicians in differential diagnosis.
However, IIF method has some disadvantages. The major ones are: the low level of standardization, the interobserver variability which limits the reproducibility of IIF readings; the lack of resources and adequately trained personnel; the photobleaching effect, which bleaches significantly the tissues in a few seconds. Such drawbacks affect the diagnosis repeatability, therefore limiting the procedure reliability. In literature the intra-laboratory variability has been estimated equal to 7-10%. Indeed, humans are limited in their ability to detect and diagnose disease during image interpretation due to their non-systematic search patterns and to the presence of noise. In addition, the vast amount of image data that is generated makes the detection of potential disease a burdensome task and may cause oversight errors. Another problem is that similar characteristics of some abnormal and normal structure may cause interpretational errors.
Automation may offer a solution to the growing demand of diagnostic tests for systemic autoimmune diseases, as in other areas of medicine.
Being able to automatically determine the presence of autoantibodies in IIF would enable easier, faster and more reliable tests.
Hence, an evident medical demand is the development of a Computer-Aided Diagnosis (CAD) system, which may support the physician’s decision and overcome current method limitations. Indeed CAD methods, which have definitely been proven effective in other contexts, (i)allow to perform a pre-selection of the cases to be examined, enabling the physician to focus his/her attention only on relevant cases, making it easier to carry out mass screening campaigns, (ii) serve as a second reader, thus augmenting the physician’s capabilities and reducing errors, (iii) aid the physician while he/she carries out the diagnosis, (iv) work as a tool for training and education of specialized medical personnel.
Besides providing image acquisition and traditional image post-processing tools, the main functionality of a CAD regards the automatic classification of the images.
The analysis of the literature in the field of ANAs detection reveals that a comprehensive CAD system in IIF is not available yet, while the use of digital images in IIF have been recently validated and recent research on partial CAD system can be found in the literature.
Medical Context
IF slides are examined at the fluorescence microscope, and their diagnosis requires both the estimation of fluorescence intensity and the description of staining pattern.
The sample fluorescence intensity is divided into three classes, named negative, intermediate and positive.
Among the many staining pattern which can be observed, six of them are relevant to diagnostic purposes (Figure 1):
- homogeneous: diffuse staining of the interphase nuclei and staining of the chromatin of mitotic cells;
- fine speckled: fine granular nuclear staining of interphase cell nuclei;
- coarse speckled: coarse granular nuclear staining of interphase cell nuclei;
- nucleolar: large coarse speckled staining within the nucleus, less than six in number per cell;
- cytoplasmatic: fine fluorescent fibres running the length of the cell;
- centromere: several discrete speckles ( 40-60) distributed throughout the interphase nuclei and characteristically found in the condensed nuclear chromatin.
Since IIF is a subjective, semi-quantitative method, physicians act differently when the same sample is presented to them: some are more conservative and others more liberal, depending mostly on their skills and background, giving rise to classification variability. Another significant reason of uncertainty is the low contrast of borderline and negative samples.
In order to guarantee the correctness of the test, producers add to the slides some mitotic cells which give to medical doctors the confidence with their decisions. Remember that Mitosis is the process by which a eukaryotic cell separates the chromosomes in its cell nucleus into two identical sets in two nuclei.
In IIF, mitotic cells are important in IIF for two reasons. First, we can be sure that the well has been correctly prepared if we are able to detect at least one fluorescent mitotic cell.
Second, they provide information on the staining pattern since they match with certain kind of patterns, including all stainings of antigens with different distribution throughout the cell cycle, such as midbody, CENP-F, mitotic splindle, centriole/centrosome and NuMA staining.
Notice that producers typically guarantee that a certain percentage of mitosis appear in each slide (approximalety 2-3 cells per images are in mitotic phase), but give no information about their location.
Mitotic cells of HEp-2 substrate may exhibit two fluorescent patterns. In the first, the cell body is fluorescent, while the collapsed chromosomes mass located in the middle part of the cell does not exhibit a fluorescent pattern, or it has a weak fluorescence. This kind of mitotic pattern is named as negative mitosis (panels A and B of Figure 2). In the second pattern, we can observe the opposite situation, i.e. the cell body is weakly or not fluorescent, while the chromosomes mass is fluorescent. An example of this type of mitotic cell, referred to as positive mitosis, is shown in panels C and D of Figure 2.
Database Description
Specialists take HEp-2 images with an acquisition unit consisting of the fluorescence microscope (40-fold magnification) coupled with a 50Wmercury vapor lamp and with a digital camera. The camera has a CCD with squared pixel of equal side to 6.45 µm. The images have a resolution of 1388×1038 pixels, a color depth of 24 bits and they are stored in bitmap format. Specialists manually segment and annotate each cell at a workstation monitor since at the fluorescence microscope is not possible to observe one cell at a time, and report data on fluorescence intensity (according to the three classes reported above), pattern ( according to the six classes reported above) and mitosis phase. Firstly, a biomedical engineer segmented the cells by the use of a tablet PC. Subsequently, each image was reviewed and annotated by a medical doctors specialized in immunology.
For each image the database provided a description file containing:
- Image’s Pattern and intensity;
- Objects seed points;
- Objects class: cell, mitotic cell, artifact (due to slides preparation process);
- Objects pattern (if is a cell): homogeneous, fine speckled, coarse speckled, nucleolar, cytoplasmatic and centromere.
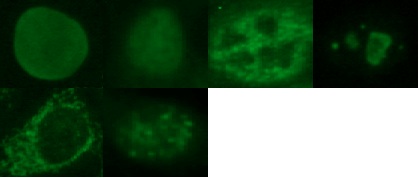 Figure 1. Example of the homogeneous, fine speckled, coarse speckled, nucleolar, cytoplasmatic and centromere staining patterns (left to right).
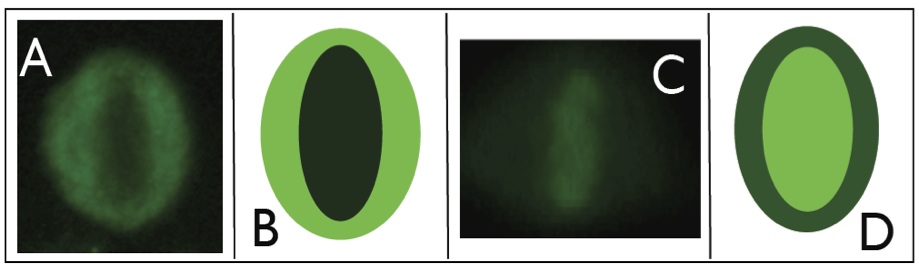 Figure 2. Figure 2. Example of the homogeneous, fine speckled, coarse speckled, nucleolar, cytoplasmatic and centromere staining patterns (left to right).
Examples and stylized representations of positive (panels A-B) and negative (panels C-D) mitosis. Light and dark green represent high and low fluorescence.
The following table provides an overview of the content for each image out of 28.
| ID | Pattern | Intensity | Objects | Cells | Number of Mitosis |
|---|---|---|---|---|---|
| 1 | Homogeneous | positive | 64 | 61 | 3 |
| 2 | Fine Speckled | intermediate | 52 | 48 | 3 |
| 3 | Centromere | positive | 93 | 89 | 4 |
| 4 | Nucleolar | intermediate | 73 | 66 | 3 |
| 5 | Homogeneous | intermediate | 52 | 47 | 2 |
| 6 | Coarse Speckled | positive | 77 | 68 | 1 |
| 7 | Centromere | intermediate | 62 | 56 | 3 |
| 8 | Nucleolar | positive | 60 | 56 | 1 |
| 9 | Fine Speckled | positive | 52 | 46 | 2 |
| 10 | Coarse Speckled | intermediate | 36 | 33 | 3 |
| 11 | Coarse Speckled | intermediate | 49 | 41 | 7 |
| 12 | Coarse Speckled | positive | 57 | 49 | 2 |
| 13 | Centromere | positive | 52 | 46 | 4 |
| 14 | Centromere | intermediate | 67 | 63 | 2 |
| 15 | Fine Speckled | intermediate | 68 | 63 | 5 |
| 16 | Centromere | positive | 44 | 38 | 5 |
| 17 | Coarse Speckled | positive | 20 | 19 | 1 |
| 18 | Homogeneous | positive | 43 | 42 | 1 |
| 19 | Centromere | intermediate | 70 | 65 | 3 |
| 20 | Nucleolar | intermediate | 49 | 46 | 0 |
| 21 | Homogeneous | intermediate | 66 | 61 | 4 |
| 22 | Homogeneous | positive | 120 | 119 | 1 |
| 23 | Fine Speckled | positive | 53 | 51 | 1 |
| 24 | Nucleolar | positive | 75 | 73 | 1 |
| 25 | Cytoplasmatic | intermediate | 24 | 24 | 0 |
| 26 | Cytoplasmatic | positive | 47 | 36 | 6 |
| 27 | Cytoplasmatic | intermediate | 44 | 38 | 2 |
| 28 | Cytoplasmatic | intermediate | 13 | 13 | 0 |
Each image folder contains the following files:
- The image stored in bitmap format;
- A gimp file (.xcf) in which you can find the mask of each object stored in a separated channel. The channel is named by the object ID reported in the description file (see .xls file);
- A bitmap image containing the masks of all the cells overlapped in a single image (Fig. 3);
- A description file (.xls) with the following fields: (i) dilution, (ii) substrate, (iii) magnification, (iv) image intensity, (v) image pattern, (vi) objects ID, (vii) objects seed point, (viii) objects type, (ix) objects pattern, (x) notes;
- A comma-separated values file with the same content of the previous file (.xls).

Download
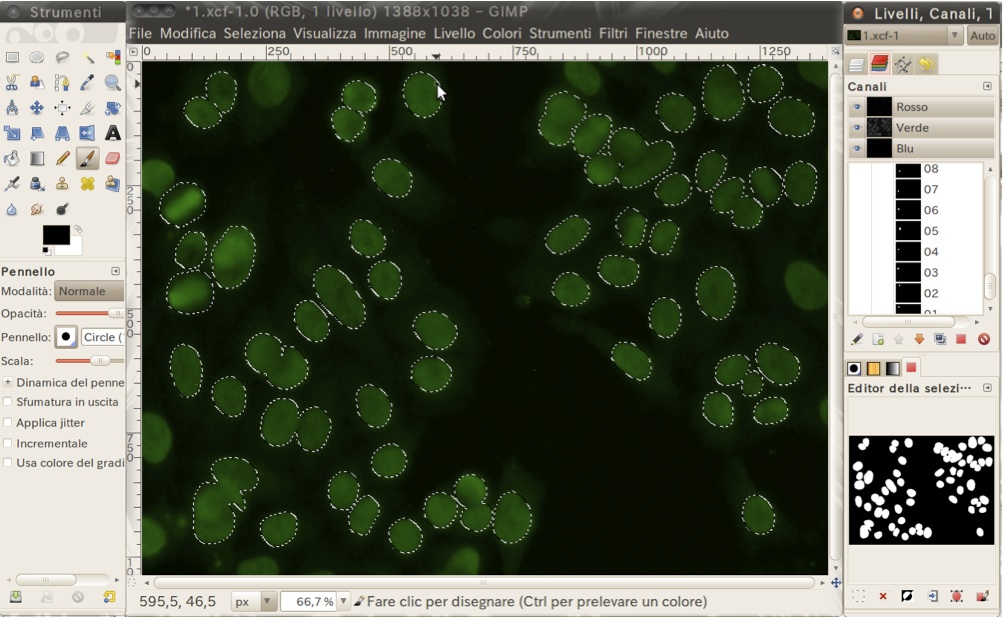 Figure 3. Example of the stored masks of the cells in the gimp file.